Productive HR reporting is critical to the ongoing success of every business. Developing an HR Dashboard that visualises your HR data in a way that tells the story of your business to the right people in the right way, is your pathway to growth and success. However, it is incredibly difficult for anyone in a business to make informed decisions when HR business partners and other stakeholders lack insight into their own operations and employees. To ensure that leadership and management have the information they need to make informed decisions, HR Professionals need to provide HR data in a way that informs, engages, inspires and persuades. In this week's HR Blog, we explore how to build the right Dashboards for productive reporting on your HR Metrics.
Key Metrics You Need in Your HR Reports
Back in 2017, we published on of our most popular blogs 'Key metrics you need in your HR reports,' which outlined almost 75 HR metrics that you need to consider including in your HR reporting.
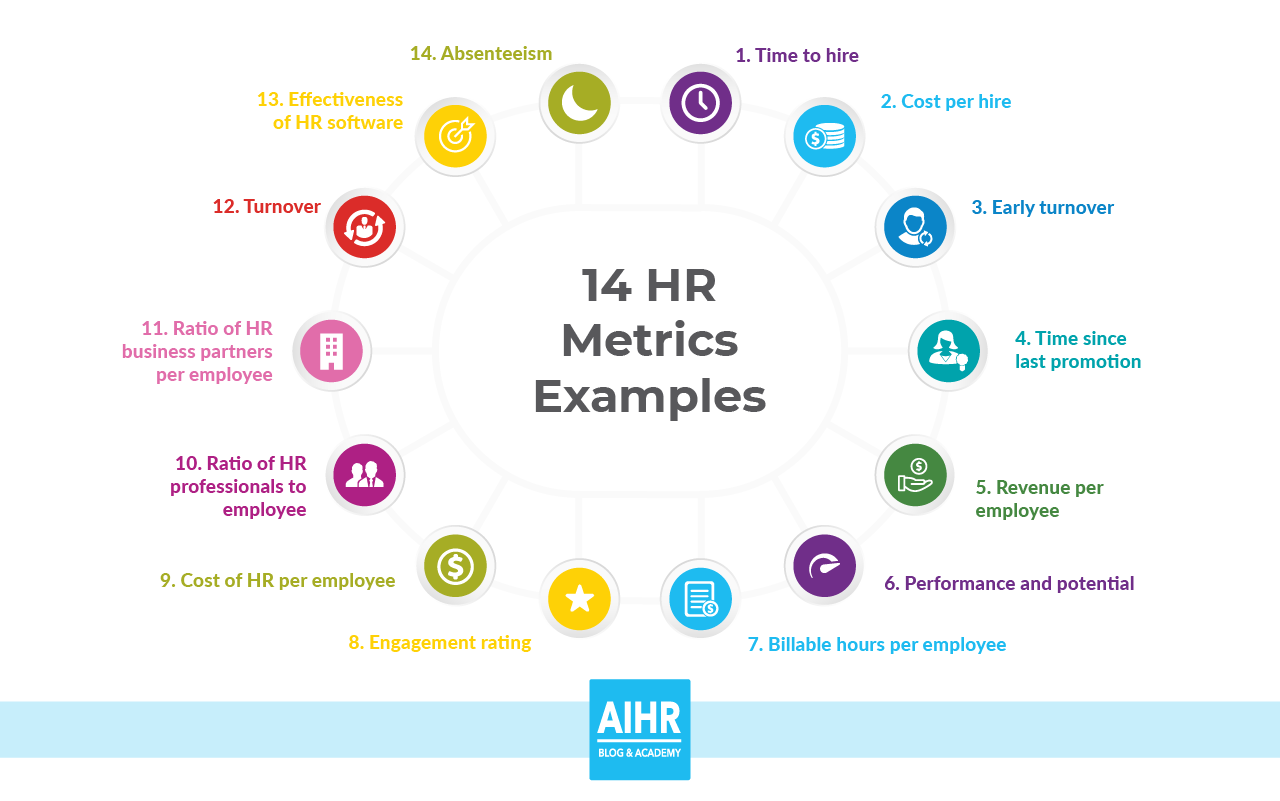
Naturally, each business is unique, and therefore the metrics you need to include in your reporting will be different to what other businesses include. However, there is a set of metrics that could be considered the foundation of HR reporting which are relevant for all businesses. According to AIHR, these metrics include:
-
Time to hire.
-
Cost per hire.
-
Early turnover.
-
Time since last promotion.
-
Revenue per employee.
-
Performance and potential.
-
Billable hours per employee.
-
Engagement rating.
-
Cost of HR per employee.
-
Ratio of HR professionals to employee.
-
Ratio of HR business partners per employee.
-
Turnover.
-
Effectiveness of HR software.
-
Absenteeism.
How do you build on this foundation to develop productive HR reporting in your business by building Dashboards that illustrate everything leadership needs to run your organisation successfully? Let's explore the Dashboard design process.
Three Success Factors For HR Dashboards
Providing accurate reporting on your employees and business operations is one of HR’s essential functions. When developed correctly, reporting and dashboards provide three key benefits for both HR, management and leadership:
-
Ongoing assessment: Dashboards enable HR to keep a finger on the pulse of the business by tracking key workforce metrics in real time. New trends and opportunities can be spotted early on and emerging problems can be addressed before they significantly impact the business.
-
Management insight: An HR report can also help managers make better choices. A well designed HR dashboard visualises HR data that informs managers about relevant developments in their teams and department. When, for example, the marketing department struggles with high turnover and a long time-to-hire, managers will be more likely to put emphasis on retaining employees and will be aware of risks like longer replacement times when someone is about to leave.
-
Identify and observe problem areas: real-time dashboards also provide a great way to track key problem areas in a transparent way. Transparency in turnover rates per manager will encourage them to pay closer attention to retaining employees because their own reputation is on the line. By tracking problem areas, HR can leverage its position to drive improvements.
If you want to uncover more about the key ingredients for effective HR reporting - take a look at this blog.
How Develop Intelligent Dashboards the Drive Productive HR Reporting
Productive HR reporting and great dashboards is all about storytelling. The art of storytelling means 'businesses are better able to capture and communicate mission-critical knowledge, improve listening skills to break down barriers between co-workers, increase cross-team collaboration, and tell powerful, memorable stories' both inside and outside the organisation. This means that before you start the process of building your HR Dashboard/s, there are a few considerations to be made that revolve around questions like:
-
Who are you communicating the HR data / metrics to?
-
What is the purpose of the HR data - what decision making process/es do the metrics needs to inform?
-
When, as in how frequently, do the HR data / metrics need to be assessed and analysed?
-
Where and in what context does this HR data need to be presented and understood?
-
Why is this HR data / metric important and what purpose is served by presenting it?
-
How is this metric / HR data best presented?
Getting clear about the answers to these questions will inform how you build and present the metrics that are important to your business, but they are not the only considerations. Below we've outlined other important factors in your dashboard development process.
In need Cloud HR software to automate and optimise your HR reporting and build intelligent Dashboards? Take a look at our Reporting solution.
Automated vs. Manual Reporting
Despite the transformation of HR through digitisation, there are still a lot of businesses working with ad-hoc, excel HR data reports. In such organisations, when a manager or director wants to know something about the workforce, they request a 'report' from HR. Upon receipt of such a request, the HR department might have to work overtime to produce a report that accurately presents the relevant data. This is an example of (inefficient and) reactive reporting. HR reports should be able to be deployed (pro)actively and should, therefore, be automated, digitised and available in real-time.
Static vs. Dashboard Reporting
Continuing on from the previous point, a lot of businesses still work with manual/paper reports built in excel. This isn’t necessarily bad: When the information isn’t prone to change, paper reports can be quite effective.
Also, an email containing a report might be more likely to be seen than a poorly designed or infrequently updated HR dashboard. This is because people won’t use dashboards that don’t add value or enhance the decision making process.
A well-designed digital dashboard, however, provides an opportunity for your audience to drill down to a very granular level of detail about workforce performance. Interactive dashboards enable you to drill down into your HR data and make observations and assessments about everything that matters to your business so that you can then make informed strategic decisions that improve performance and deliver growth.
There are many more considerations and decisions required when developing dashboards, too many to be outlined in this HR blog post. That's why we've created a FREE eGuide that outlines how you can set your business up for success by developing dashboards that provide productive HR reporting. Discover how simple, automated, engaging HR reporting can reduce friction and deliver powerful results that help you inform, engage, inspire and persuade the right audience at the right time.

Image Credit: AIHR 14 HR Metrics examples.